The Talent Plan Process uses two forms of grid display to give a visual summary:
-
On the Tile
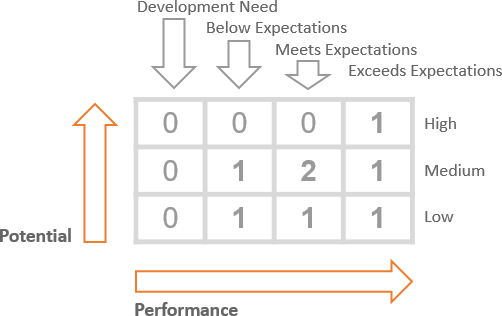
A grid representing your Team's performance against potential, with values giving the number of Team Members awarded each performance/potential combination:
- The grid can display up to five rows and five columns - because of the space constraints of the Tile.
- Each row represents a rating for potential, typically Low, Medium, and High, from bottom to top.
-
Each column represents a rating for performance, ascending from left to right; in our example Development Need, Below Expectations, Meets Expectations, Exceeds Expectations.

When there are more than five ratings for either Performance or Potential, scores are normalized to convert them to one of five values.
- On the Talent Plan Team display
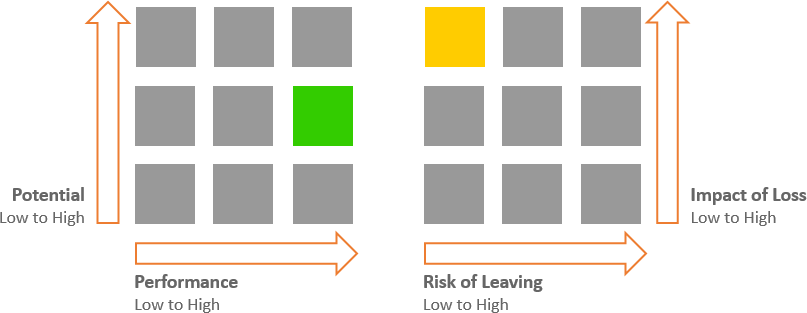
Two 9-box grids using colored tiles to represent the ratings for the Team Member, the left grid for performance against potential, the right grid for risk of leaving against impact of loss:

When there are more than three ratings for Potential, Performance, Risk of Leaving, or Impact of Loss, scores are normalized to enable their display in a 9-box grid.