If your organization has CRM Analytics Platform or CRM Analytics Plus licenses, you can create and maintain your own custom dashboards. Creating your own dashboards enables you to include any custom fields you have added to your org, and to chart data points not covered by the standard dashboards delivered by Sage People.
You can clone the dashboards delivered by Sage People to explore how they are put together. You can also view the recipes to understand how the datasets delivered by Sage People are constructed, and use the datasets in your recipes to create your own datasets and dashboards.
If you directly modify the dashboards, datasets, or recipes delivered by Sage People, you risk losing your changes when Sage People delivers updates the standard dashboards.
Enable CRM Analytics
To create custom dashboards, you need to first enable the functionality in your org. Accessing the option to enable CRM Analytics does not display unless the logged in user has a CRM Platform license and the CRM Analytics Platform User permission set assigned as a minimum.
To assign the permission set:
-
Go to Setup, and in Quick Find enter permission, then select Permission Sets from the search results.
-
From the list of permission sets, select CRM Analytics Platform User.
-
On the CRM Analytics Platform User permission set page, select Manage Assignments.
-
On the Current Assignments page, select Add Assignment.
-
On the list of users, select the checkbox next to your system administrator user. Then select Next.
-
On the Select an Expiration Option for Assigned Users page, leave No expiration date selected, and select Assign.
-
On the Assignment Summary page, select Done.
To enable CRM Analytics:
-
Go to Setup, and in Quick Find enter analytics, then select Getting started under Feature Settings > Analytics > Analytics from the search results.
-
On the Getting Started page, select Enable CRM Analytics:

Sage People displays the CRM Analytics pre-flight check screen until the environment is set up. The screen changes to the CRM Analytics is enabled screen when the enabling is complete.
-
Select OK.
Enabling CRM Analytics adds 2 new users to your org if they do not already exist: Integration User and Security User.
Create an Analytics app
Before you start building your custom dashboards, create an Analytics app to host them. This helps you to keep your custom dashboards, datasets, and recipes separate from the standard Sage People items, and avoid any issues when the Sage People delivered items are updated.
-
From the App Launcher, select Analytics Studio.
-
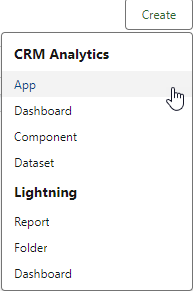
From the top right corner, select Create, and then from the CRM Analytics items select App:
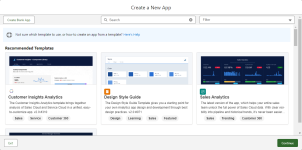
Analytics Studio displays the Create a New App dialog:
-
On the Create a New App dialog, you can select a template. Most of the templates are designed for sales analytics. Your recommended options are to:
-
If your primary aim is to use the app purely for hosting cloned dashboards, datasets, or recipes for exploring them:
-
Select Create Blank App.
Analytics Studio displays Blank App Details.
-
Select Continue.
-
On the Name your app screen, give the app a name, and then select Create.
Analytics Studio creates the app and displays the app's page. The asset list will be empty.
-
-
If your primary aim is to create an app to host your custom dashboards, datasets, and recipes:
-
Select the Design Style Guide template, and then select Continue.
Analytics Studio displays Design Style Guide Details, describing what the template delivers.
-
Select Continue.
-
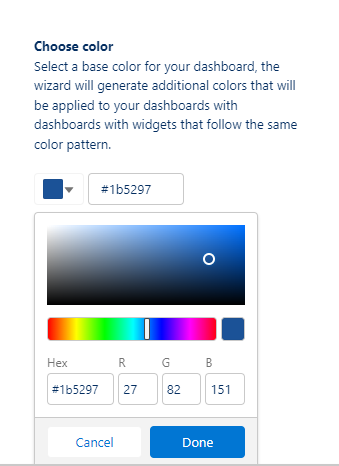
On the Design Style Guide - Personalize screen, enter a hex code for your organization's primary brand color, or other color you want to use, or select a color from the color picker, then select Done:
-
Select Looks good, next.
-
On the Name your app screen, give the app a name, and then select Create.
Analytics Studio creates the app and displays a progress page. When the app is complete, the status displays as Application Complete!.
-
Select Open to go to the app to view the automatically created assets, which provide examples and good practice for creating your custom dashboards.
-
-
Set up access to data from your org
A connected object is an object in your org available for Analytics Studio. The standard Sage People dashboards set up connections to the following objects:
-
Employment Record
-
HR Department
-
Salary
-
Team Member
-
Work Location
You can add other fields to be included in the synchronization between your org and Analytics Studio, and you can add other objects as connected objects.
Add fields to a connected object
The standard connections include only selected fields. To add fields to a connected object:
-
From the App Launcher, select Analytics Studio.
-
In Analytics Studio, from the sidebar select Data Manager.
-
From the sidebar, select Connections.
Data Manager displays the connections set up in your org, such as SFDC_LOCAL.
-
On the list of objects for SFDC_LOCAL, find the connected object for which you want to add fields. For example, fHCM2__Employment__c.
Data Manager displays the columns for the object. Columns are fields selected for the Analytics Studio connection.
-
Select the checkbox next to a column name for the fields you want to add.
-
Select Save.
-
On the list of connected objects, the Status for the object you edited changes to Not Synced. Data for the fields you added will not be available until it is synchronized. To run a sync now:
-
Select the down arrow for the object and then select Run Data Sync.
-
From the Run Data Sync dialog, select Run Full Sync.
-
You can also add fields to connected objects when you select them for recipes.
Add an object as a connected object
The Workforce Insights package creates connections to objects in your org for the objects used by the dashboards. If you want to use data from other objects in your dashboards, you need to add them as data sources.
-
From the App Launcher, select Analytics Studio.
-
From the sidebar, select Data Manager.
-
From the sidebar, select Connections.
Data Manager lists the existing connections available for Analytics Studio.
-
For SFDC_LOCAL, select the down arrow, and then select Edit Objects.
Data Manager displays the Edit objects for SFDC_LOCAL screen.
-
On the list of objects, select the checkbox next to an object you want to make available for Analytics Studio. You can use search to find the object.
After selecting the object, Data Manager displays the object's fields on the right side of the Edit objects for SFDC_LOCAL dialog.
-
Select the fields you want to use for dashboards. You must include the Record ID field and at least one other field.
-
Select Save.
-
If you want to sync the data from the new object immediately, select the down arrow next to the object, and:
-
Select the down arrow for the object and then select Run Data Sync.
-
From the Run Data Sync dialog, select Run Full Sync.
-
???? Grant access to the Integration User ????
???? do we need these steps. The user's profile has view all access????
Create a recipe
-
From the App Launcher, select Analytics Studio.
-
In Analytics Studio, from the sidebar select Data Manager.
From the sidebar select Recipes.
-
On the Recipes page, select New Recipe.
Data Manager displays the recipe canvas.
-
Select Add Input Data.
Data Manager displays the datasets and connected objects available. This includes the datasets delivered by Sage People.
-
Select the input data sources you want to include in the recipe. You can choose if you want include all columns, or only a selection of them. Then select Next.
Data Manager adds the selected data sources as input data nodes on the recipe canvas.
-
Select + next to the node to access the options:
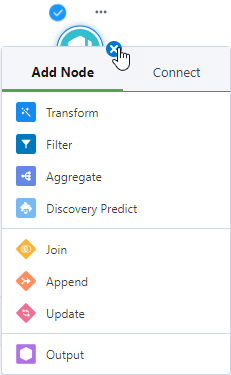
You can:
-
transform data in one or more columns
-
filter data. For example, to exclude deleted records or team members who have left your organization.
-
aggregate to summarize and group large amounts of data.
-
join, append, or update data.
-
create an output, such as a dataset. This is typically the last node in a recipe.
-
-
When you have added all the nodes you need, select Save.
Data Manager displays the Save Recipe dialog.
-
Enter a name for the recipe and an optional description of the version, then select Save.
-
To run the recipe to build the dataset, select Save and Run.
Clone a recipe
-
From the App Launcher, select Analytics Studio.
-
In Analytics Studio, from the sidebar select Data Manager.
From the sidebar select Recipes.
-
Select the name of a recipe you want to view, such as SP Workforce Insights Embedded Team Members.
Data Manager displays the recipe as workflow.
-
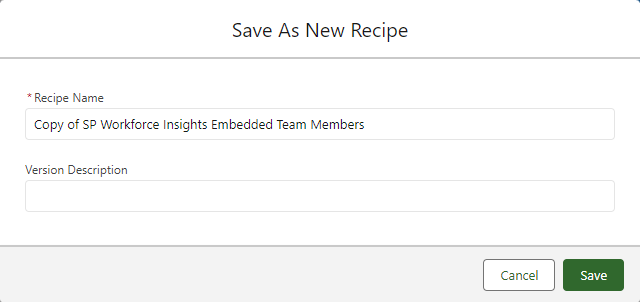
Select the down arrow next to the Save button, and Save As New Recipe.
Data Manager displays the Save As New Recipe dialog:
-
Give a name to the recipe and an optional version description, and select Save.
You can now use the clone as a starting point for creating datasets for your custom dashboards. Make sure you create a new dataset as the output of the recipe.
Clone a dashboard
-
From the App Launcher, select Analytics Studio.
-
In Analytics Studio, from the sidebar select Browse.
By default, when you go to the Browse page, your recent items are displayed.
-
Select Dashboards to only view dashboards on the Browse page.
-
Next to a dashboard, such as Team Lead Workforce Insights, select the down arrow and then select Edit.
-
In the top right corner, select the down arrow and then select Clone in New Tab:
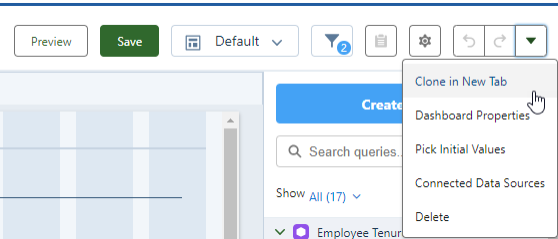
Analytics Studio displays a new tab in the workspace, named Copy of <dashboard name>.
-
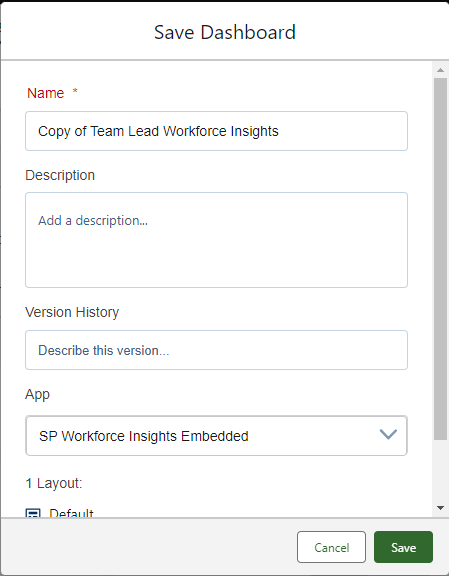
On the cloned tab, select Save.
Analytics Studio displays the Save Dashboard dialog:
-
Complete the following details for the cloned dashboard as a minimum:
-
Name
-
App. Make sure you select an app you have created for your org, not the SP Workforce Insights Embedded app.
-
-
Select Save.
Making custom dashboards available to users
???? details tbc for WX users????
